Introduction
In the dynamic world of financial markets, understanding the ebb and flow of price movements is essential for any trader seeking success. Among the foundational principles of technical analysis, support and resistance levels stand as steadfast guides, helping traders decipher market dynamics. In this comprehensive guide, we’ll delve into the intricacies of support and resistance trading, unraveling the significance of these key concepts and providing practical insights for incorporating them into your trading strategy.
Understanding Support and Resistance: Pillars of Market Analysis
Support and resistance are fundamental concepts in technical analysis, representing key price levels at which the market has historically reacted. These levels act as psychological boundaries, shaping the behavior of market participants and influencing future price movements.
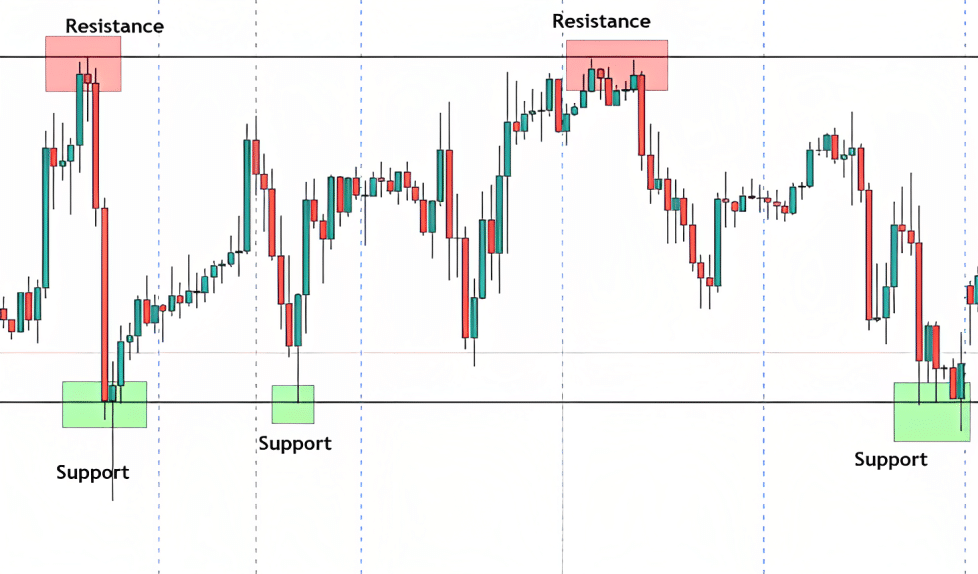
1. Support Levels: The Safety Net for Prices
Support levels are zones where buying interest is historically strong enough to prevent prices from falling further. Traders often observe support levels as opportunities to enter long positions, expecting a bounce in prices. Support can manifest at various points, such as historical lows, moving averages, or trendlines.
2. Resistance Levels: The Ceiling for Ascent
Conversely, resistance levels represent zones where selling interest historically halts price advances. Traders view resistance as potential areas to initiate short positions, anticipating a reversal or pullback. Resistance can materialize at historical highs, moving averages, or trendlines.
3. Identifying Support and Resistance: Practical Techniques
- Price Levels: Observe historical price levels where the market has previously experienced reversals.
- Trendlines: Draw trendlines connecting consecutive highs (resistance) or lows (support).
- Moving Averages: Utilize moving averages as dynamic support or resistance zones.
- Psychological Levels: Consider round numbers and psychological barriers that may influence market behavior.
Incorporating Support and Resistance into Your Trading Strategy: Practical Insights
- Confirmation through Multiple Indicators: Combine support or resistance levels with other technical indicators (e.g., RSI, MACD) for confirmation before making trading decisions.
- Dynamic Nature of Levels: Recognize that support and resistance levels can evolve over time. Regularly reassess and adjust your analysis based on the current market conditions.
- Price Action Analysis: Pay attention to price action around support and resistance zones. Breakouts or bounces with significant volume can provide valuable signals.
- Timeframes Matter: Validate support and resistance levels across different timeframes to gain a holistic view of market conditions.
Risk Management in Support and Resistance Trading: Safeguarding Your Trades
- Setting Stop-Loss Orders: Place stop-loss orders below support (for long trades) or above resistance (for short trades) to manage risk.
- Calculating Risk-Reward Ratios: Ensure that potential profits outweigh potential losses by calculating and maintaining a favorable risk-reward ratio.
Conclusion: Navigating Market Swings with Confidence
Incorporating support and resistance into your trading strategy equips you with a powerful framework for navigating market swings. These foundational concepts provide valuable insights into potential trend reversals, entry and exit points, and risk management. By understanding the psychology behind support and resistance levels, traders can approach the markets with confidence, making informed decisions in the ever-changing landscape of financial markets. Happy trading!